假設檢定 Hypothesis Testing
假設檢定 Hypothesis Testing
以統計方法進行決策的過程中,會提出兩個假設:
H0: null hypothesis (虛無假設)。
H1: alternative or research hypothesis(對立假設、研究假設)。
H1: alternative or research hypothesis(對立假設、研究假設)。
把想要檢定的假設定為 H1,H0 則為其相反之假設。
零假設的內容一般是希望被證明為錯誤的假設或者是需要著重考慮的假設。比如說,在相關性檢驗中,一般會取「兩者之間無關聯」作為零假設,而在獨立性檢驗中,一般會取「兩者之間是獨立」作為零假設。
首先,假設 null hypothesis 為真。據此進行推論。
可能的結論:
可能的結論:
(i) 有足夠的統計證據可推論 alternative hypothesis 為真 (rejecting the null hypothesis in favor of the alternative)。
(ii) 沒有足夠的統計證據可推論 alternative hypothesis 為真 (not rejecting the null hypothesis in favor of the alternative)。
(ii) 沒有足夠的統計證據可推論 alternative hypothesis 為真 (not rejecting the null hypothesis in favor of the alternative)。
假設檢定可能犯的錯誤:
Type I error (第一型錯誤): reject a
true null hypothesis. P(Type I error) =
α. α 又稱為 significance
level (顯著水準)。
Type II error (第二型錯誤): don't reject a false null hypothesis. P(Type II error) = β.
Type II error (第二型錯誤): don't reject a false null hypothesis. P(Type II error) = β.
通常的做法是,在保持第一類錯誤出現的機會在某個特定水平上的時候(即顯著性差異值或α值),儘量減少第二類錯誤出現的機率。
已知母群體標準差檢定母群體數算平均數
Q:
從範例較容易瞭解假設檢定的概念,舉例如下。
便利商店經理根據財務分析,認為若顧客平均每次消費金額高於$170,發行NFC卡將可以獲利。
假設每次消費金額是常態分佈,標準差為$65。
現以400人進行取樣,發現樣本算術平均數(sample mean)為$178。
便利商店經理是否能夠推論發行NFC卡可以獲利?
A:
假設每次消費金額是常態分佈,標準差為$65。
現以400人進行取樣,發現樣本算術平均數(sample mean)為$178。
便利商店經理是否能夠推論發行NFC卡可以獲利?
A:
我們想要檢定的假設是
H1: μ>170
therefore, null hypothesis為
H0: μ<=170
但若我們設定 H0: μ=170,也可以達到和上式相同的結論,而這樣的設定的好處是我們可以直接以母群體算術平均數為μ來進行計算,因此實際上我們設定的null hypothesis會只取等式的部份,以此例為
H0: μ=170
主要有2種方式可以進行假設檢定:
H1: μ>170
therefore, null hypothesis為
H0: μ<=170
但若我們設定 H0: μ=170,也可以達到和上式相同的結論,而這樣的設定的好處是我們可以直接以母群體算術平均數為μ來進行計算,因此實際上我們設定的null hypothesis會只取等式的部份,以此例為
H0: μ=170
主要有2種方式可以進行假設檢定:
1. rejection
region method
2. p-value approach
2. p-value approach
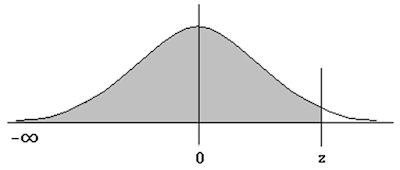
Rejection Region
若檢定統計量(test statistic,舉例來說,樣本算術平均數)落在 rejection region,我們會決定 reject the null hypothesis in favor of the alternative。

見上圖,以此例而言,rejection region為,
 其中
其中 為樣本算術平均數。
根據 Type I error 的定義,可推導出
α = P(rejecting H0 given that H0 is true)
= P(
 given that H0 is true)
如果便利商店經理設定 α 為 5%,則 zα = 1.645,因此

因此 rejection region 為
 > 175.34
因為取樣得到的樣本算術平均數是178,落在 rejection region,我們 reject the null hypothesis,有足夠的證據可推論 alternative hypothesis: μ>170 為真。
p-Value Approach
p-value是在假設 null hypothesis 為 true 的前提下,觀察到檢定統計量 (test statistic) 比取樣得到的值更極端的機率。
以此例而言,

根據取樣分佈,當母群體算術平均數(population mean)為170時,我們觀察到樣本算術平均數大於178的機率是0.0069,因為這樣的機率很低,我們懷疑假設 null hypothesis 為 true 的前提,因此我們 reject the null hypothesis,而推論 alternative hypothesis 為真。
p-value要多小,才適合推論 alternative hypothesis為真?
這取決於犯下Type I 及 Type II錯誤的成本,若成本很高,會需要較低的值,才推論 alternative hypothesis為真。
p-value < 0.01: there is overwhelming evidence to infer that the alternative hypothesis is true. The test is highly significant.
0.01 < p-value < 0.05: there is strong evidence to infer that the alternative hypothesis is true. The test is significant.
0.05 < p-value < 0.10: there is weak evidence to infer that the alternative hypothesis is true. The test is not statistically significant.
0.10 < p-value: there is no evidence to infer that the alternative hypothesis is true. The test is not statistically significant.
計算 Type II Error 的機率
根據 Type II error 的定義,以前例而言,可推導出
β = P( < 175.34, given that the null hypothesis
is false)
< 175.34, given that the null hypothesis
is false)
以前例而言,若顧客平均每次消費金額(μ)高於$180,發行NFC卡的獲利會很高使得便利商店經理不願意犯 Type II error (發行NFC無法獲利),因此
β = P( < 175.34, given that μ=180)

意即如果母群體算術平均數實際上是180,錯誤地 not reject the null hypothesis 的機率是 0.0764。
β = P(
 < 175.34, given that the null hypothesis
is false)
< 175.34, given that the null hypothesis
is false)以前例而言,若顧客平均每次消費金額(μ)高於$180,發行NFC卡的獲利會很高使得便利商店經理不願意犯 Type II error (發行NFC無法獲利),因此
β = P(
 < 175.34, given that μ=180)
意即如果母群體算術平均數實際上是180,錯誤地 not reject the null hypothesis 的機率是 0.0764。
「犯下Type I error的機率」和「Type II error的機率」的關聯性
若試著降低犯下 Type I error 的機率 (α),犯下 Type II error 的機率 (β) 將會升高。
要如何取捨犯下 Type I error 及 Type II error 的機率,取決於犯下 Type I error 及 Type II error 導致的代價。
樣本數的影響
若增加樣本數(sample size),可以在不改變 α 的情況下,降低 β。
樣本數愈大,代表資訊愈完整,犯錯的機率會降低,作出的判斷品質會提高。
決定 alternative hypothesis 的方式
以前例而言,若「決定發行NFC卡但實際上無法獲利」的代價(e.g. 若發行NFC卡但無法獲利會賠1個資本額)比「決定不發行NFC卡但實際上可以獲利」嚴重,因為我們想要避免犯下代價較高的錯誤,我們會把目標設定為證實發NFC卡可以獲利,因此假設會安排如下:
H0: μ = 170
H1: μ > 170
反之,若「決定不發行NFC卡但實際上可以獲利」的代價(e.g. 若不發行NFC卡會少賺1個資本額)較嚴重,我們會把目標設定為證實發NFC卡無法獲利,因此假設會安排如下:
H0: μ = 170
H1: μ < 170
留言
張貼留言